SmartHomeShop Cloud
One app for all your SmartHomeShop kits. Follow live what your home uses in electricity, gas, and water, how healthy your indoor air is, and even which rooms are occupied. With twelve months of history, costs in euros, and alerts you configure yourself.
Example view of the dashboard
Energy & water
No good decisions without data. The app reads your smart meter and water meter live, and translates every kilowatt-hour, every cubic metre of gas, and every litre of water into euros, based on your own rates.
Live power, per phase too. See instantly what happens when you switch on the oven or EV charger, including voltage and current per phase.
Feed-in from your solar panels. Generation, usage, and feed-in side by side, per day, month, and year.
Costs with your own rates. Enter your energy contract with off-peak and standard rates, gas, water, and standing charges. You then see your usage in euros instead of kilowatt-hours.
Find your standby usage. The app analyses what your home quietly uses at night, calculates what that costs per year, and gives concrete saving tips.
Water and leak detection. Follow your water usage by the minute and get an alert when water keeps running. Many customers have caught a running toilet this way.
Example view of the energy overview
Example view of the room overview
Indoor climate, air quality & presence
The UltimateSensor, UltimateSensor Mini, and CeilSense measure much more than temperature: from CO₂ and particulate matter to who is present in which room. The app turns it into one clear picture per room, so you know when to ventilate instead of guessing.
CO₂ with clear colour zones. At a glance you see whether a room needs fresh air, whether at home, at the office, or in the meeting room.
Particulate matter, VOC, and NOx. From PM1 to PM10, plus volatile compounds. See the effect of cooking, a fireplace, or your air purifier directly in the charts.
Comfort per room. Temperature, humidity, light level, sound level, and air pressure: all per room, with history.
Presence via mmWave radar. Know not just that someone is present, but also where and how many: up to four zones per sensor, including person counting. See which rooms are occupied and when.
Ventilation alert. Set a limit, for example CO₂ above 1200 ppm for more than 10 minutes, and get notified automatically.
Add a device using its device ID and the app automatically recognises which kit it is and which sensors it carries. Every kit also measures the temperature and humidity of its surroundings by default.
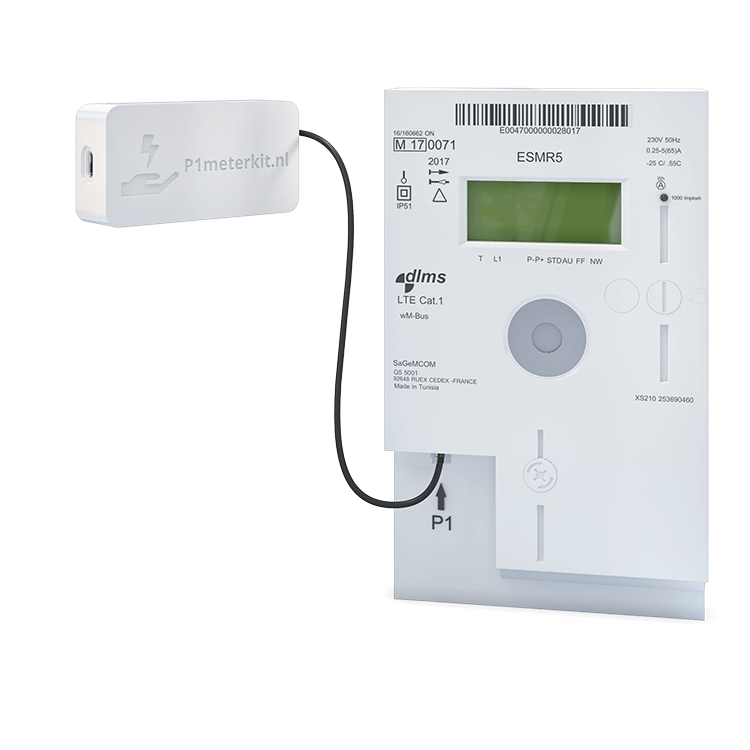
Reads your smart meter through the P1 port: per-phase power and voltage, feed-in, off-peak and standard tariffs, and gas usage.
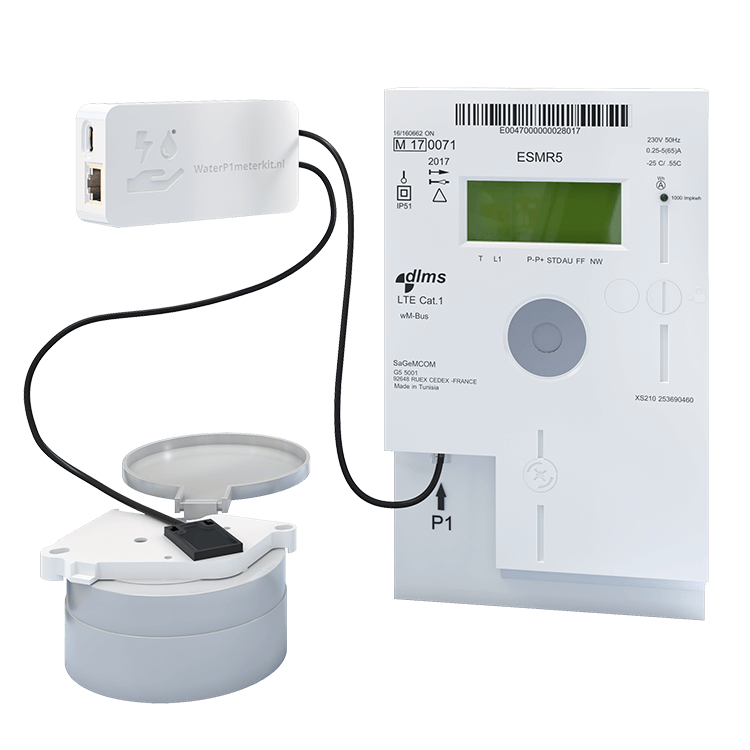
Smart meter and water meter in one device: electricity, gas, and water combined. Also supports Belgian digital meters and can be powered over PoE.
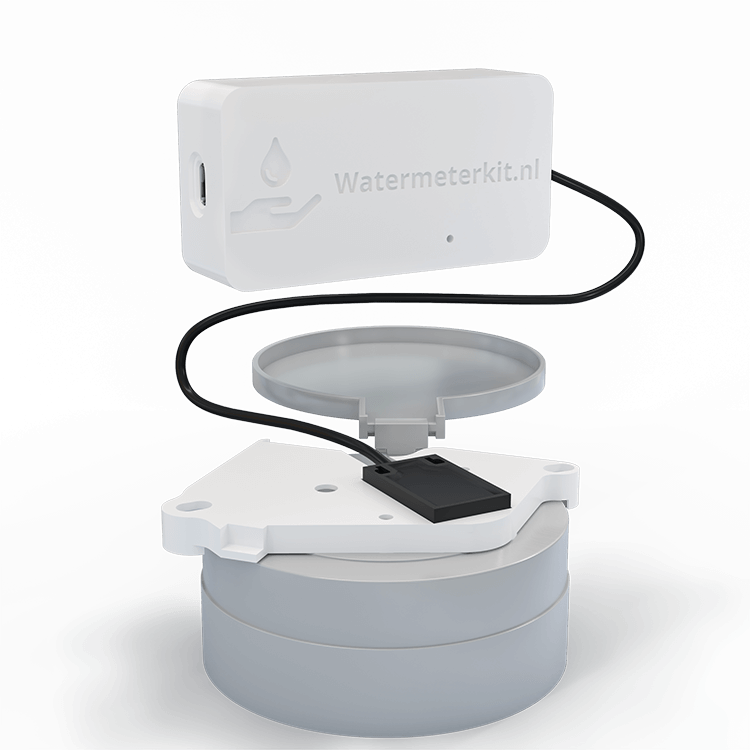
Makes your existing water meter smart. Compatible with Actaris, Elster, Honeywell, Itron, Sensus, and more, with usage per minute, daily totals, leak detection, and a meter reading that survives reboots and updates.
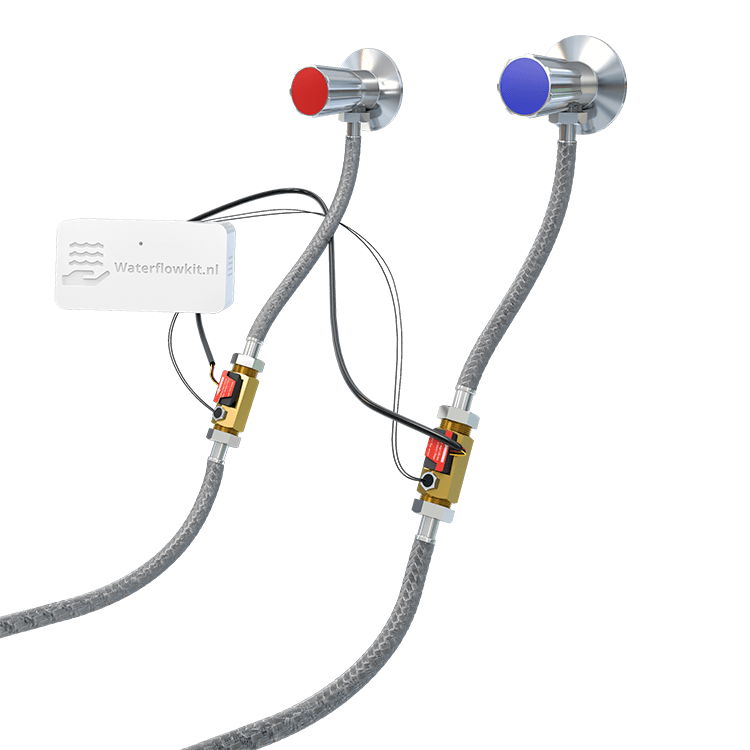
Measures water anywhere in your home: at the toilet, shower, boiler, or heat pump. Two to four flow sensors, each with its own name, flow rate, and water temperature. Five sensor types from small pipes up to DN50, calibratable per sensor.
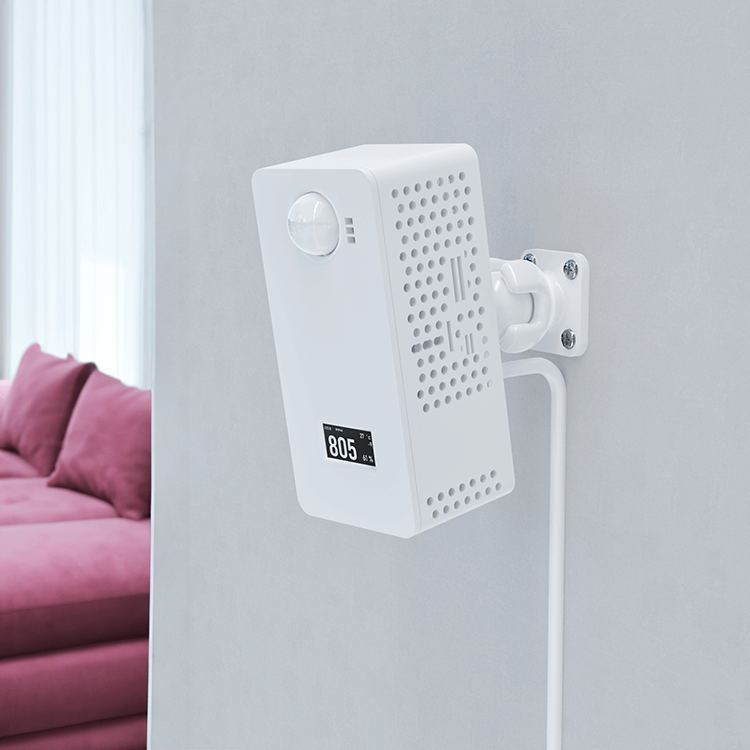
The complete indoor climate station: CO₂, VOC, NOx, particulate matter, light, sound level, and presence via mmWave radar with target tracking across four zones. With an OLED display, and a microphone plus speaker for the Home Assistant voice assistant with a local wake word.
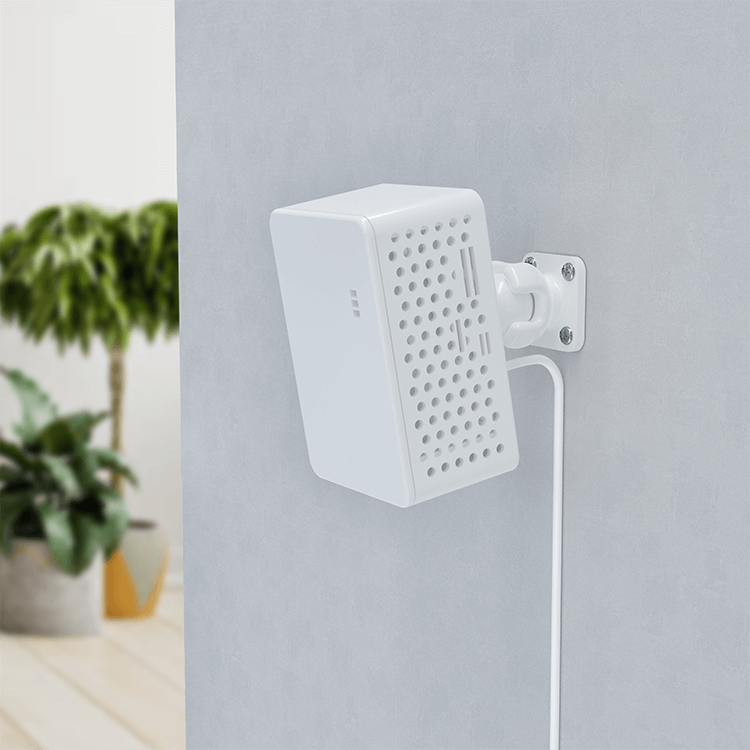
Measures CO₂, VOC, NOx, particulate matter, and light just like its bigger brother, in a compact form factor with three radar zones for presence, RGB lighting, and voice assistant support.
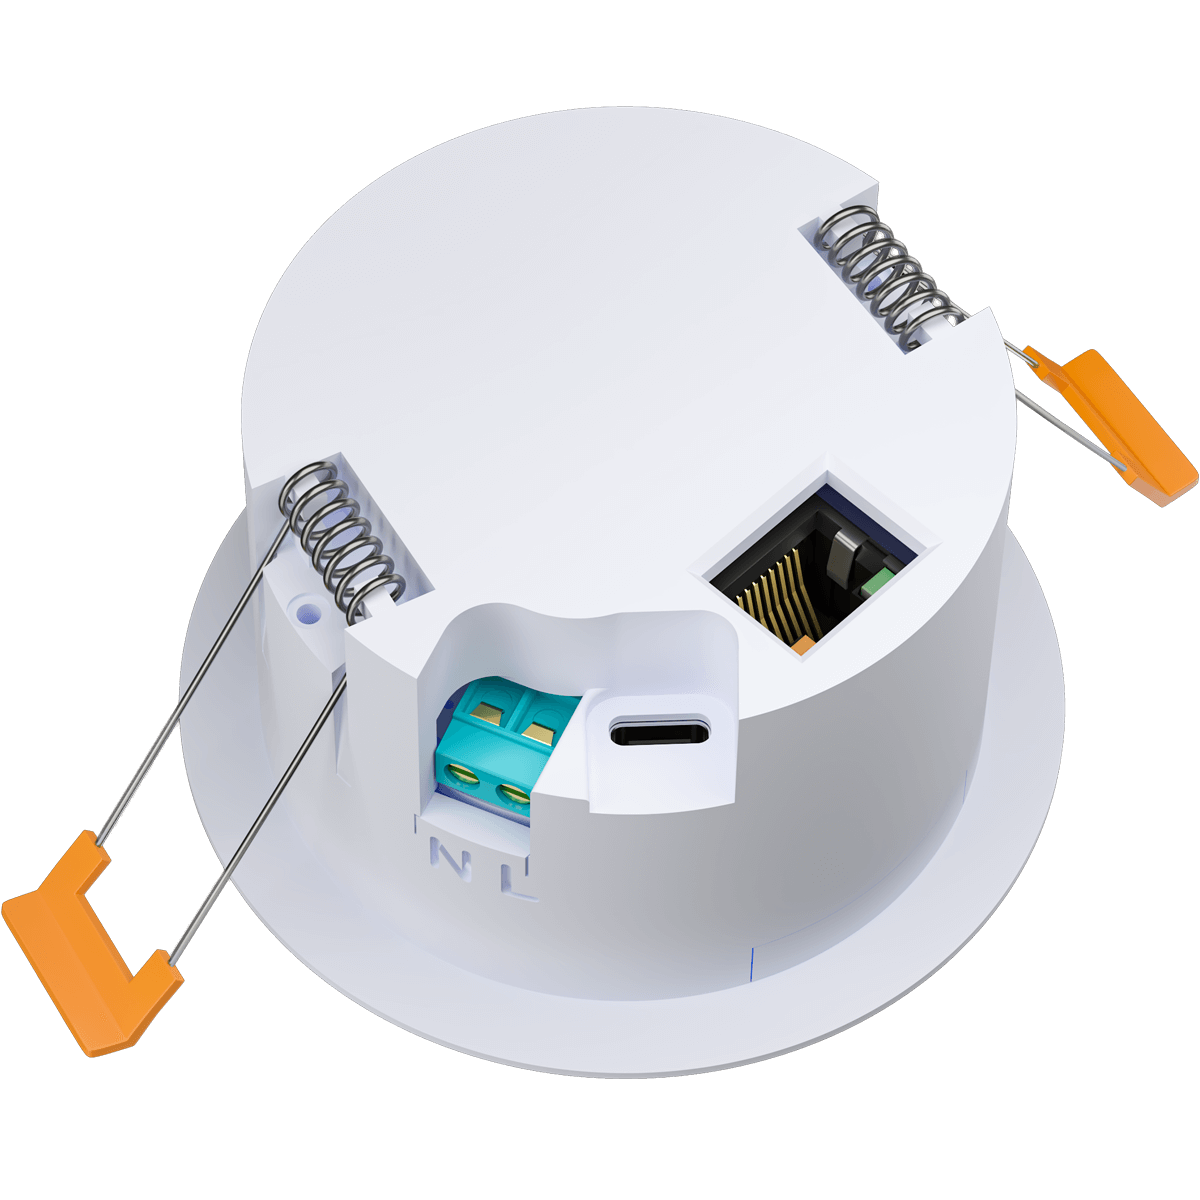
Ceiling sensor with radar presence detection, CO₂, temperature, humidity, air pressure, and illuminance. Barely noticeable on the ceiling while it measures the whole room, including presence.
New products are added to the app as they are released.
Whether you own one kit or ten: the same history, the same alerts, and the same management for all your devices.
Twelve months of history for everyone, free accounts included. Charts automatically switch between hourly and daily resolution, and you can put periods side by side: this month versus last month, this year versus last year.
Set rules per device with a threshold, duration, and cooldown: from leak detection to a CO₂ warning. Via email, push, or webhook, with a log of every alert that was sent.
Manage your home, holiday house, or business premises in one account. Each location has its own address, devices, and energy contract, so the costs are right per building.
Export readings as CSV, XLSX, or JSON, connect your own software through the REST API, and install firmware updates straight from the app. Sensors can be calibrated per device.
No hub, no extra hardware. Your kit sends its readings straight to your account.
Registration takes a minute. No payment details required; the base account stays free.
Enter the device ID shown in your kit's web portal, or let the app discover the device on your network. Give it a name and a location.
Your readings start flowing right away. Set up your energy contract and alert rules, and your overview is complete.
The app is optional. Every kit keeps working fully local with Home Assistant and ESPHome, even without an account. You can use both routes side by side: automate locally in Home Assistant and check in from anywhere with the app.
See the manuals for local installationUnlimited devices and twelve months of history are included in every plan, the free account too. You only upgrade for extras such as export, API, or white-label.
forever
or € 30 per year
or € 60 per year
for installers and companies
Current prices and terms are always shown in the app under Subscription.
Create a free account, add your kit with its device ID, and your first readings appear in the app within minutes.